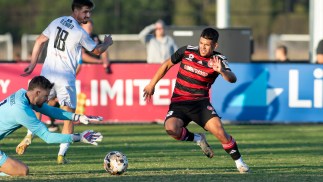
Opta Data have pulled out some fast facts ahead of the all Hyundai A-League Westfield FFA Cup Semi Final clash between Western Sydney Wanderers and Adelaide United tonight at Campbelltown Stadium.
You can get tickets to the match at the gates or purchase online here.
PREVIOUS MEETINGS
- These two sides have met on 16 occasions in the Hyundai A-League with both teams winning five games each, with six matches ending in draws.
- There have been 39 goals scored across all fixtures with Wanderers netting 21 goals to Adelaide’s 18, with an average of 2.44 goals scored per game.
- Adelaide have not conceded a first half goal against the Wanderers in their last seven meetings.
HYUNDAI A-LEAGUE 2017/18 SEASON
ATTACK
- In the opening two Hyundai A-League fixtures this season, Wanderers have netted four goals to Adelaide’s three.
- WSW have attempted 23 shots with an accuracy of 43.5% while Adelaide are slightly less accurate having made 25 shots at 32%.
PASSING
- Possession-heavy Wanderers have made 945 passes at an accuracy of 83.1% with Adelaide attempting considerably less with 801 passes at 73.7%.
- But Adelaide have dominated in the attacking third, playing 133 balls into the final third compared to Wanderers 95.
- The Reds have also knocked in 38 crosses into the box with Wanderers firing in just 15.
DEFENCE
- Wanderers have conceded 4 goals in the opening two rounds while the Reds have shipped three goals.
- Western Sydney have a better tackling success rate with the Red and Black winning nearly 67% of their challenges compared to Adelaide’s 62%.


